
Property Auction Insights
September 2023
In the realm of property auctions, knowledge is key, and Property Auction Insights is your ultimate source for unlocking the secrets of this dynamic market. As we venture into our third instalment, our focus turns to an in-depth review of two crucial aspects: the escalating growth within auction entries and the geographical tapestry of the country's most coveted roads for auction sales.
The landscape of property auctions changes regularly, demanding more than just passive observation. Whether you're a seasoned investor seeking to capitalise on market movements or a curious individual aiming to grasp the finer details, our comprehensive analysis offers insights and guidance.
Focus On: Insights into the surge in residential listings
In recent months, the property auction market has witnessed a noteworthy surge in the number of properties making their way to auction. This surge, which was reported in June, revealed a remarkable 22.1% growth in the number of properties listed for auction, with an even more substantial 32.2% consisting of residential stock. A closer analysis of these statistics has unveiled fascinating insights into the changing dynamics of the property market, highlighting a variety of reasons behind this increase and its potential implications.
The rise of residential auction listings
The question on many minds was whether the influx of auctioned residential properties was attributed to a wave of tenanted stock. Many speculated that landlords, seeking to divest their portfolios, were contributing to this surge. To demystify these claims, our team conducted an in-depth review of residential stock, categorising properties into three main groups: Dwellings (including houses, flats, HMOs, and blocks), Land (comprising land, sites, and plots), and Others (encompassing garages, ground rents, and other residential property types).
The analysis spanned across two periods, comparing January to July of both 2022 and 2023. The results illuminated an interesting trajectory in the growth of various property types, ultimately shaping the landscape of residential auctions.
A comprehensive breakdown of growth
Houses emerged as the frontrunners in terms of growth, experiencing a staggering 31% increase in listings. This surge represented a considerable 58% of the total growth in residential entries. Flats saw a 25% increase, accounting for 20% of the total residential entries. The category of Land also marked a growth of 25%, contributing 15% to the overall residential growth.
While the remaining property types experienced only nominal increases, the dominance of Houses and Flats in shaping the growth narrative became evident. In fact, Dwellings (houses, flats, HMOs and blocks) collectively constituted a significant 82% of the total residential growth over the analysed period.
Stock Increases
A breakdown comparing volume of sales Jan-Jul 2022 versus Jan-Jul 2023 by property type (excluding commercial/mixed use)
Share of Total Residential Increase
Graph demonstrates how the 32.2% growth in residential stock is split by property type in the category
Unravelling the Tenanted vs. Vacant dynamic
When we clustered the data into the three categories and compared the month by month changes, it became very apparent the primary growth in the residential sector has been from Dwellings. While Land and Other remained stable, Dwellings have seen a dramatic rise across the start of this year. To shed light on the role of tenanted properties in this dynamic, we drilled down further to ascertain the distribution between vacant and tenanted entries, providing a clearer picture of the motivations driving properties to auction.
Interestingly, tenanted properties demonstrated a level of stability, exhibiting only a marginal increase. This growth contributed to a mere 6% of the total residential growth. In contrast, vacant houses emerged as a pivotal factor, witnessing a substantial rise of 57%. Vacant flats followed suit, marking a 15% increase. Collectively, vacant Dwellings represented an overwhelming 75% of the total residential growth.
All Properties
A month by month comparison from Jan - Jul 2022 and 2023 of sales by property type for residential stock.
Dwellings (including houses, flats, HMOs, and blocks), Land (comprising land, sites, and plots), and Others (encompassing garages, ground rents, and other non-specific property types)
Dwellings Only
A month by month comparison from Jan - Jul 2022 and 2023 of sales of vacant and tenanted dwellings stock (incorporating houses, flats, HMOs, and blocks)
Revealing the underlying trends
The surge in auctioned residential properties, often speculated to be driven by landlords divesting their portfolios, appears to have multifaceted reasons behind it. The data suggest that landlords are increasingly opting to sell properties once tenants vacate, rather than investing in costly refurbishment. This approach may stem from limitations in accessing funds for renovations or a strategic decision to avoid further financial commitment.
Mortgage terms expiring and rental incomes failing to cover mounting monthly costs have also emerged as drivers of this trend. With the inability to increase rents to match rising expenses, selling properties becomes a viable option for landlords. Moreover, potential buyers are exhibiting a preference for properties with comprehensive legal documentation, including right to rent checks and deposit scheme information, further influencing landlords' decisions, as these documents are key if a Section 21 or Section 8 notice has to be issued.
Property investors, when interviewed, corroborate these observations, reinforcing the notion that landlords are indeed divesting their portfolios. Additionally, properties struggling to gain traction in the private treaty market are finding their way to auction, particularly if owners are grappling with mounting mortgage payments and increasing utility bills, choosing a fast and secure exit strategy to avoid any further rising debts.
Navigating the perfect storm
The coming together of rising mortgage rates, slow to perform rental incomes, and the pressing need for exit strategies has created a "perfect storm." The dramatic increase in mortgage rates since the end of Q1 2022, coupled with the inability to raise rents proportionally, is pushing property owners to expedite their exit plans. The urgency to secure a stable financial future before further rate hikes compound the challenge is driving many to auction their properties.
In conclusion, the surge in properties making their way to auction, particularly in the residential segment, is driven by a confluence of factors including landlords divesting, the economic realities of mortgage expirations, and an increasingly discerning buyer market. As the property auction landscape continues to evolve, these insights provide a nuanced understanding of the market's transformation and the motivations shaping its trajectory.
Focus On: Discovering the UK's most popular roads for property auctions
In the dynamic landscape of the UK's property auction market, certain roads have become synonymous with the excitement and intrigue of property auctions. These roads, scattered across towns and cities, have witnessed a consistent surge in properties hitting the rostrum over the past five years. Our comprehensive review of residential sales data has unveiled the top contenders for auction action, shedding light on the factors that make them hotspots for property enthusiasts and investors alike.
The auction appeal: What sets these roads apart
The allure of auction properties lies in their diversity and uniqueness. From unconventional structural elements to strategic locations, several factors contribute to the higher number of properties making their way to the auction floor. Structural intricacies like non-standard construction, susceptibility to subsidence, or being situated in flood-prone zones often push homeowners to opt for the auction route. Furthermore, roads hosting properties with proximity to key areas such as universities or hospitals – think HMOs (Houses in Multiple Occupation) and flats – tend to experience an influx of auction properties due to the high rental demand in those areas.
Socio-economic dynamics also play a role. Areas with lower income demographics and consequently lower owner-occupancy rates are more likely to see properties heading to auctions. Lease issues, especially those concerning leasehold properties with shorter terms, contribute to this phenomenon, as traditional mortgage providers are often hesitant to lend on such properties.
The auction hubs: Where the action unfolds
Among the diverse tapestry of the UK's property market landscape, certain hubs have emerged as epicentres for auction properties. These hubs include London, Hartlepool, Liverpool, Bradford, and Peterlee. Within these locales lie roads that have experienced a remarkable number of auction sales, each weaving its own unique story within the larger market.
The landscape of property types at auction
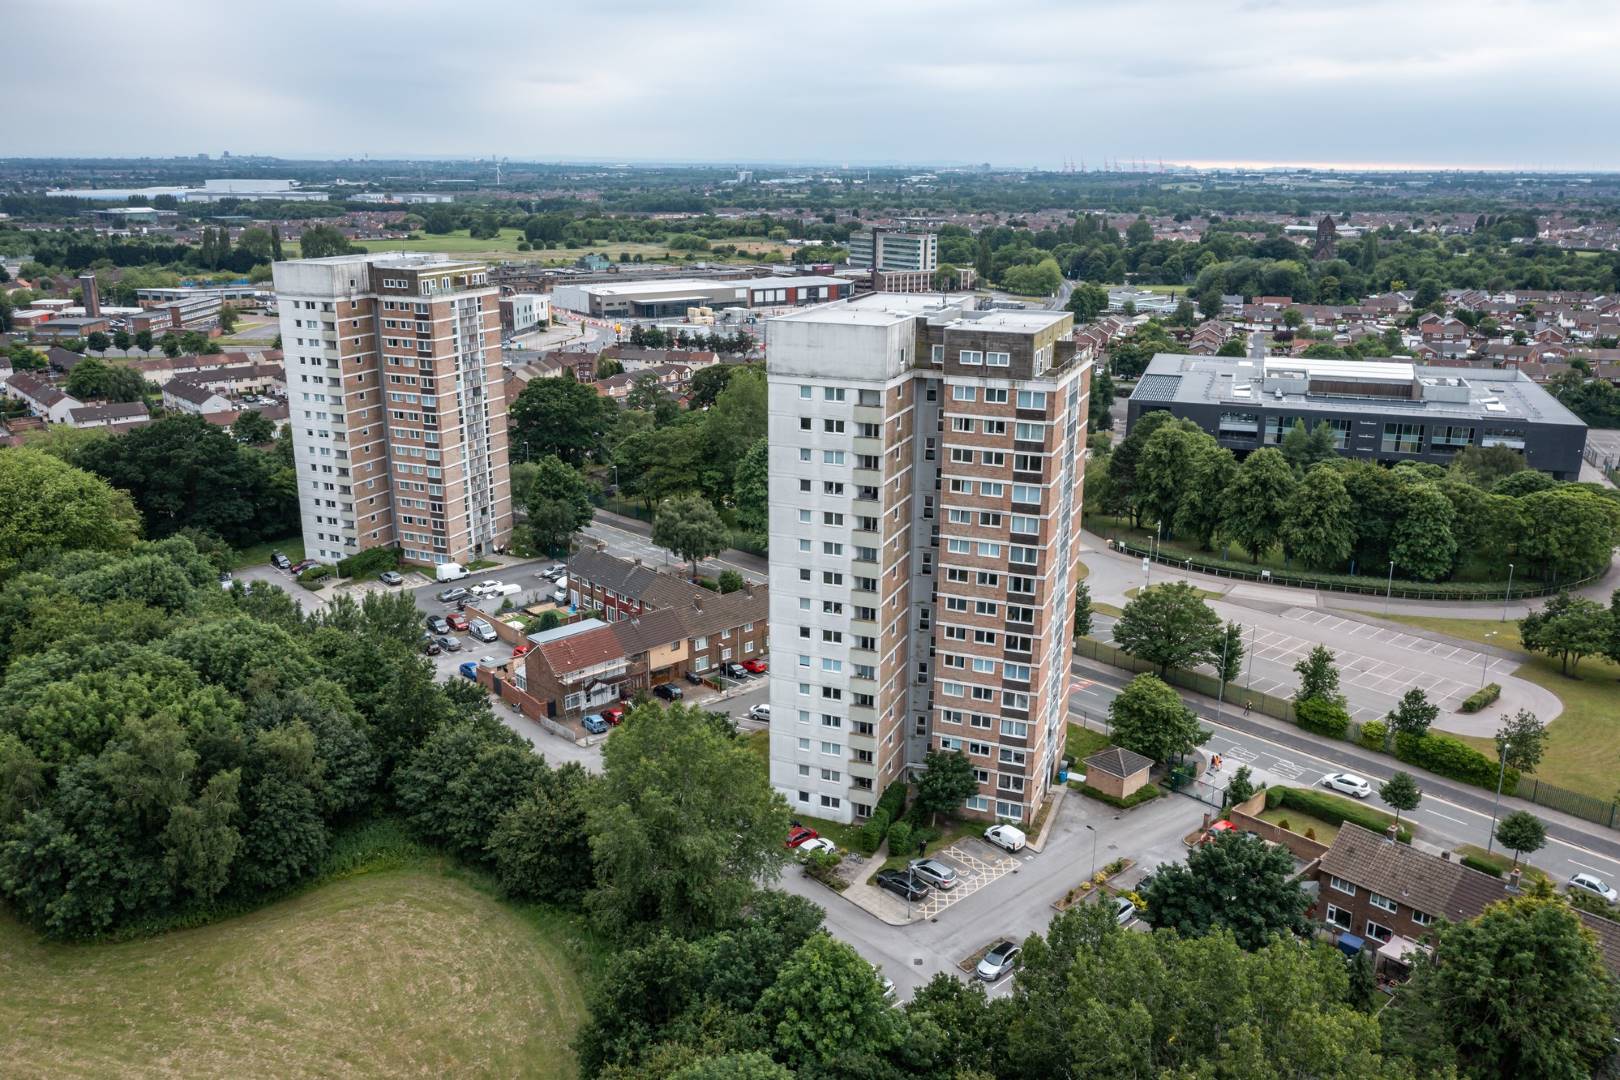
A deep dive into the auction landscape reveals that roads with high auction property counts predominantly feature flats or terrace houses. Among the towns and cities examined, 42 roads offered flats, 38 featured terrace houses, and 13 included semi-detached houses. However, one intriguing outlier stands out – Uttoxeter New Road in Derby, seeing numerous Block/HMO properties coming to auction. This road is a critical link between the university and the hospital and it embodies the evolving demand of the modern housing market.
National
| Region Name | Roads | Occurrences |
|---|---|---|
| South-East Home Counties | 1,218 | 5,455 |
| North-East | 851 | 4,842 |
| East Midlands | 700 | 3,136 |
| Yorkshire and The Humber | 785 | 3,926 |
| South-West | 370 | 1,535 |
| West Midlands | 1,222 | 5,514 |
| North-West | 1,552 | 7,940 |
| North-West Home Counties | 426 | 1,998 |
| Wales | 388 | 1,813 |
| Scotland | 73 | 304 |
| Northern Ireland | 24 | 84 |
| East Anglia | 711 | 1,991 |
| London | 837 | 3,677 |
Most popular road
Address:
Roughwood Drive, Liverpool, L33
Primary Property Type:
Flats
Number of Lots Sold: 118
North-West
| City | Roads | Occurrences |
|---|---|---|
| Liverpool | 723 | 3,156 |
| Manchester | 418 | 1,306 |
| Bolton | 170 | 550 |
| Burnley | 108 | 493 |
| Blackpool | 127 | 411 |
| Birkenhead | 89 | 360 |
East Anglia
| City | Roads | Occurrences |
|---|---|---|
| Norwich | 164 | 441 |
| Ipswich | 74 | 259 |
| Great Yarmouth | 68 | 224 |
| Peterborough | 52 | 156 |
| Wisbech | 48 | 137 |
| King's Lynn | 47 | 124 |
East Midlands
| City | Roads | Occurrences |
|---|---|---|
| Nottingham | 325 | 951 |
| Leicester | 282 | 894 |
| Derby | 210 | 637 |
| Chesterfield | 74 | 146 |
| Mansfield | 72 | 230 |
| Gainsborough | 46 | 190 |
London
| City | Roads | Occurrences |
|---|---|---|
| South-East | 422 | 1,355 |
| East | 387 | 1,269 |
| South-West | 382 | 1,120 |
| North | 248 | 686 |
| North-West | 209 | 648 |
| West | 177 | 575 |
North-East
| City | Roads | Occurrences |
|---|---|---|
| Hartlepool | 113 | 807 |
| Newcastle upon Tyne | 216 | 632 |
| Peterlee | 73 | 622 |
| Middlesbrough | 152 | 565 |
| Sunderland | 134 | 469 |
| South Shields | 85 | 270 |
Northern Ireland
| City | Roads | Occurrences |
|---|---|---|
| Belfast | 24 | 53 |
| Craigavon | 6 | 14 |
| Enniskillen | 6 | 14 |
| Larne | 6 | 13 |
| Newtownards | 5 | 13 |
| Ballymena | 5 | 11 |
North-West Home Counties
| City | Roads | Occurrences |
|---|---|---|
| Reading | 99 | 303 |
| Luton | 60 | 207 |
| Harrow | 47 | 199 |
| Enfield | 52 | 154 |
| Bedford | 44 | 138 |
| Slough | 39 | 124 |
Scotland
| City | Roads | Occurrences |
|---|---|---|
| Glasgow | 40 | 98 |
| Port Glasgow | 5 | 43 |
| Aberdeen | 15 | 38 |
| Paisley | 13 | 33 |
| Stirling | 4 | 15 |
| Largs | 4 | 13 |
South-East Home Counties
| City | Roads | Occurrences |
|---|---|---|
| Southampton | 144 | 451 |
| Croydon | 86 | 331 |
| Southend-on-Sea | 65 | 261 |
| Gillingham | 58 | 180 |
| Folkestone | 54 | 176 |
| Brighton | 63 | 173 |
South-West
| City | Roads | Occurrences |
|---|---|---|
| Bristol | 247 | 681 |
| Bournemouth | 63 | 205 |
| Weston-super-Mare | 42 | 135 |
| Plymouth | 51 | 131 |
| Swindon | 38 | 108 |
| Torquay | 24 | 76 |
Wales
| City | Roads | Occurrences |
|---|---|---|
| Swansea | 152 | 457 |
| Newport | 82 | 241 |
| Cardiff | 61 | 201 |
| Ferndale | 30 | 158 |
| Wrexham | 51 | 119 |
| Mountain Ash | 22 | 101 |
West Midlands
| City | Roads | Occurrences |
|---|---|---|
| Birmingham | 566 | 1,746 |
| Stoke-on-Trent | 367 | 1,259 |
| Wolverhampton | 204 | 684 |
| Coventry | 176 | 516 |
| Walsall | 151 | 497 |
| Telford | 136 | 492 |
Yorkshire and The Humber
| City | Roads | Occurrences |
|---|---|---|
| Bradford | 281 | 1,068 |
| Sheffield | 234 | 735 |
| Leeds | 233 | 711 |
| Doncaster | 162 | 620 |
| Rotherham | 137 | 477 |
| Hull | 103 | 288 |
Analysis carried out for all sales between 2018-2023.
Roads included if two of more sales occurred during the timescale.
Key indicator of Roads
Unveiling the stars: The UK's top three auction roads
Roughwood Drive, Kirkby, Liverpool: Leading the pack is Roughwood Drive, nestled in the heart of Kirkby, Liverpool. Over the span of five years, this road has witnessed a staggering 118 sales. The primary contributors to this surge are the Beech Rise and Willow Rise apartment blocks. With a commanding presence of 15 stories, these blocks offer a mix of apartments and maisonettes.
Demesne Road, Manchester: In Manchester, Demesne Road takes the second spot with an impressive 102 sales. The star of this road is Montgomery House, a hub of student/pod accommodation. Offering an enticing blend of low initial costs and guaranteed rental options during term times, Montgomery House continues to be a favourite for those looking to venture into property investment.
Sunbridge Road, Bradford: Sunbridge Road in Bradford completes the top three with 94 sales under its belt. The road is home to Colonnade House, Sunbridge House, and Grand Mill, all of which provide pod accommodation choices near the university. This strategic positioning has resonated with student tenants, solidifying Sunbridge Road's position as an auction powerhouse.
More on student accommodation and tower blocks
The journey through the UK's auction property landscape is a captivating one, rich with diversity and opportunity. For a deeper dive into the world of student pods, tower blocks, and the myriad benefits of investing in these unique properties, our latest blog provides a comprehensive guide. To explore this enticing realm further, visit our website for an insightful exploration of auction trends, investment strategies, and success stories that continue to shape the dynamic world of UK real estate
Regional Data
Every quarter we will be including regional data from the past five years, including the number of lots sold and the average sale price. This allows you to track what is happening across the country, to spot trends, and see how changes in the wider market may be affecting auctions.
London
South East Home Counties
South West
Yorkshire & The Humber
North West
North East
West Midlands
East Midlands
East Anglia
Scotland
Wales
North West Home Counties
Northern Ireland
Regional Data Analysis
The data in these charts consist of all auction sales on a quarterly basis, including individual single lot sales, as well as conditional sales.
Interestingly, the effect of Covid on the auctions market during 2020 can clearly be identified in each region in terms of the drop in lots sold during Q2. Also, nearly all regions saw a decrease in average sales value during Q4 2022, due to the change in economic conditions affecting the housing market.
Closing Summary
The current landscape of the property auction market is undergoing a significant transformation. The surge in properties making their way to auction is undeniable, yet the key to a successful sale remains firmly tethered to competitive pricing. As evidenced by the data from our August newsletter, a 26.8% reduction in the total funds raised highlights the changing landscape at play.
The journey in the months ahead for property auctions is both uncertain and but very promising. it is imperative that we closely monitor this evolving scenario. The resilience of the market will undoubtedly be tested, but by remaining attuned to the trends and shifts, we position ourselves to navigate the fluctuations with informed decision-making.

If there are any topics you would like us to focus on in future releases, or you have any feedback or thoughts you would like to share, please contact us on insights@eigroup.co.uk.
David Leary
Director
PS. Our next edition will be released in December 2023, so if you are not already on our newsletter mailing list, sign up today!
Disclaimer: The figures in this newsletter are based on sales data provided to us by the auctioneers.